As of May 1st, we have a continuous sound level monitoring system setup outside on our terrace.
This idea has been pending for well over a year, but FUD about installing the system outdoors held things back. How would I power it? I can’t find a low-voltage waterproof wall-wart! What about our dogs barking? Shouldn’t it be on the other side of the building?
Since the system is running continuously, averaging and uploading readings every 20s, there’s no way it’s ‘low-power’, and it has to be plugged in. I can’t use solar as I originally planned. So I finally broke down and bought a cheap weatherproof 12V converter and waterproof extensions via AliExpress, installed a new waterproof outdoor in-use cover for the terrace outlet, changed the on board supply from a 5V linear regulator to a buck regulator, and built a little 4″ pvc house for the board and sound level monitor.
It works good! This plot shows noise levels for the past 8 hours and is updated every 5 minutes:
Interestingly, there were relatively few trains over the last week while I was testing things out, but suddenly this morning at the unusual time of 6:40am (usually the night train arrives ~4am) a train was passing through and making a hell of a lot of noise. I figured today was the day to finalize the first phase of the installation and get some useful graphics up.
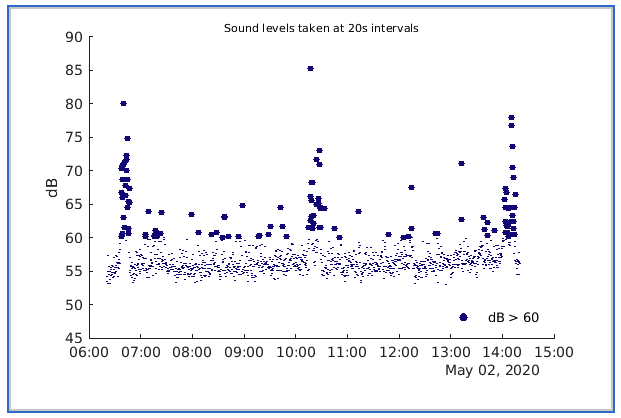
Since the image above is updating real-time, below I have a snapshot of the ‘first-day’ data so that I can reference it as I’m writing this. One issue with the data representations in my original post was that the simple plots generated with ThingSpeak are very ‘full of stuff’ (see them here). You could see what was going on, but, yeah.
The train this morning (and two subsequent trains) made it easy to come up with a way to represent the data cleanly (at least I hope so!).
Each of the dark spikes of data points in the plot is a train passing through.
The 8:40am train is at left.
Absent trains, the average city-background sound level during this period is on the order of ~56dB. As the trains pass through, the peak 20 second averaged dB levels range from 80-86dB. The monitor is located ~270 feet from the tracks.
What next? There’s a lot we can do with this. To be continued…
An aside – the trick for the representation in the image was to come up with a MATLab scheme to change the plot point sizes so that the continuous background noise levels were de-emphasized, and the train noise popped out. (The second trick was to ignore the maximum sound levels in each interval. That picks up our dogs freaking out about the neighbors and barking at the other dogs in the building.)
Since I’ve never used MATLab before, it took some time to get in tune with how it thinks. So for reference, here’s the key part of the code:
numberOfMinutes = 480;
color = [0 0 0.5];%% Read in two data arrays – ‘data’ (the sound levels)
%% and & ‘time’ (the timestamps)
[data, time] = thingSpeakRead(readChannelID, ‘Field’, fieldID, ‘NumMinutes’, numberOfMinutes, ‘ReadKey’, readAPIKey);%% Generate a logical array (‘cut’) that represents data
%% points > 60dB. It’s all about array operations here.
cut = data>60;%% Generate an array that maps spot size to data values
%% based on the cutoff criteria. Array operation, again.
spotSize = 20*cut + 2;%% Generate the scatter plot, using the spotSize array to
%% specify the size of individual data points.
s=scatter(time, data, spotSize, color, ‘filled’);
3 Comments
Monitoring train noise (i) – Jaldi Labs
[…] Edited 5.2.20 – Changed post title and updated plot references. This project has finally moved forward and the data is live. Will update shortly. […]
Matthew Alonso
Great work, can you set it to save the sound when it exceeds a threshold? That way you can prove it was train and not party/dog/emergency vehicle etc.
Let me know how I can help.
jaldilabs
Yeah, good question – something I”ve been meaning to try to work out. Dog noise is certainly an issue for us!
I’ll be returning to this project this summer to try to make this useful to us and to provide an ongoing record. That was the original idea, but it’s been sitting on the back burner for a while…